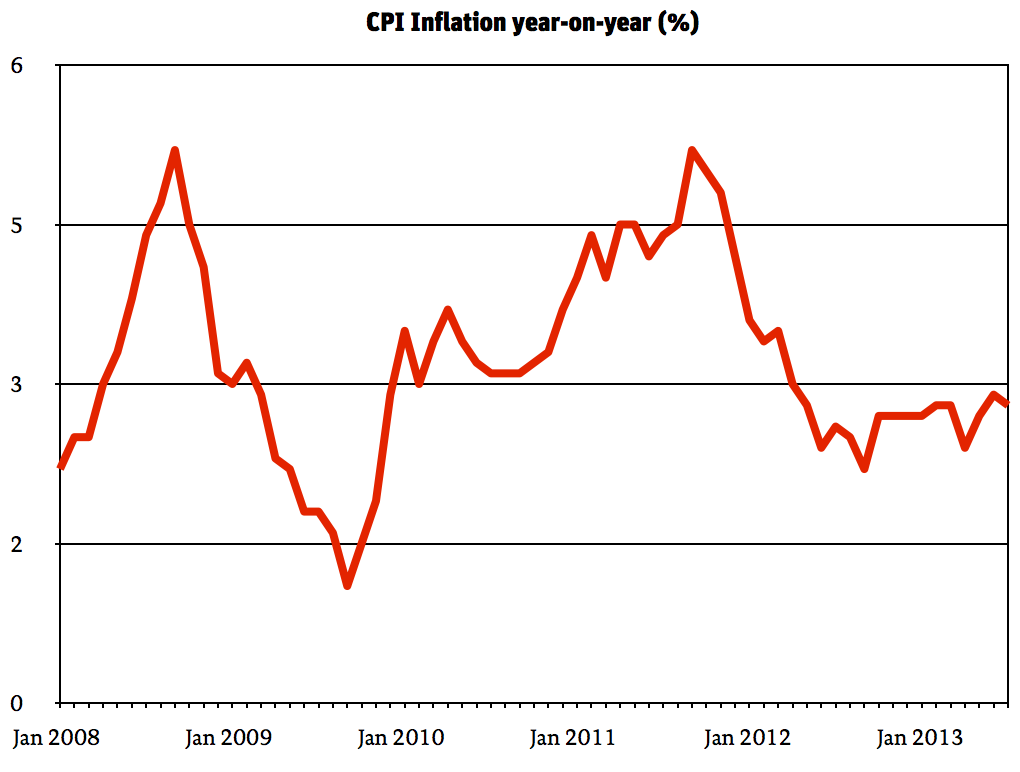
According to the ONS, the Consumer Prices Index (CPI), Britain’s headline measure of inflation, grew by 2.8% in the year to July 2013, down from 2.9% in June.
The statistics agency adds that:
The largest contributions to the fall in the rate came from air fares, plus price movements in the recreation & culture, and clothing & footwear sectors. A rise in petrol and diesel prices partially offset the fall.
Although inflation has fallen, it still far outstrips total pay increases. According to the latest figures available, pay rose by just 1.7 per cent in the year to May 2013. It has been over three years since average pay rose by more than inflation:

The RPI measure of inflation was also reported today: it rose to 3.1 per cent. Although RPI is no longer an official “National Statistic”, a number of important prices are pegged to it. This month, it feeds through into national rail fares, which are allowed to increase by a maximum of the RPI for August plus 1 per cent. As a result, fares over the next year will rise by 4.1 per cent.
The latest figure for house price increases was also released today. Over the twelve months to June, prices rose by 3.1 per cent, outstripping inflation and widening the gap between those lucky enough to own property and the rest. But as ever, the housing story reveals the gap between parts of Britain. The ONS reports:
The year-on-year increase reflected growth of 3.3% in England and 4.3% in Wales, offset by falls of 0.9% in Scotland and 0.4% in Northern Ireland.
Within England too, there were vast discrepancies:
Annual house price increases in England were driven by London (8.1%), the West Midlands (3.1%) and the South East (2.9%). Excluding London and the South East, UK house prices increased by 1.0% in the 12 months to June 2013.
Yorkshire and the Humber actually saw a decline in house prices, by 0.2 per cent, while in the South West, prices remained stable with 0.0 per cent growth.
Content from our partners


Related


